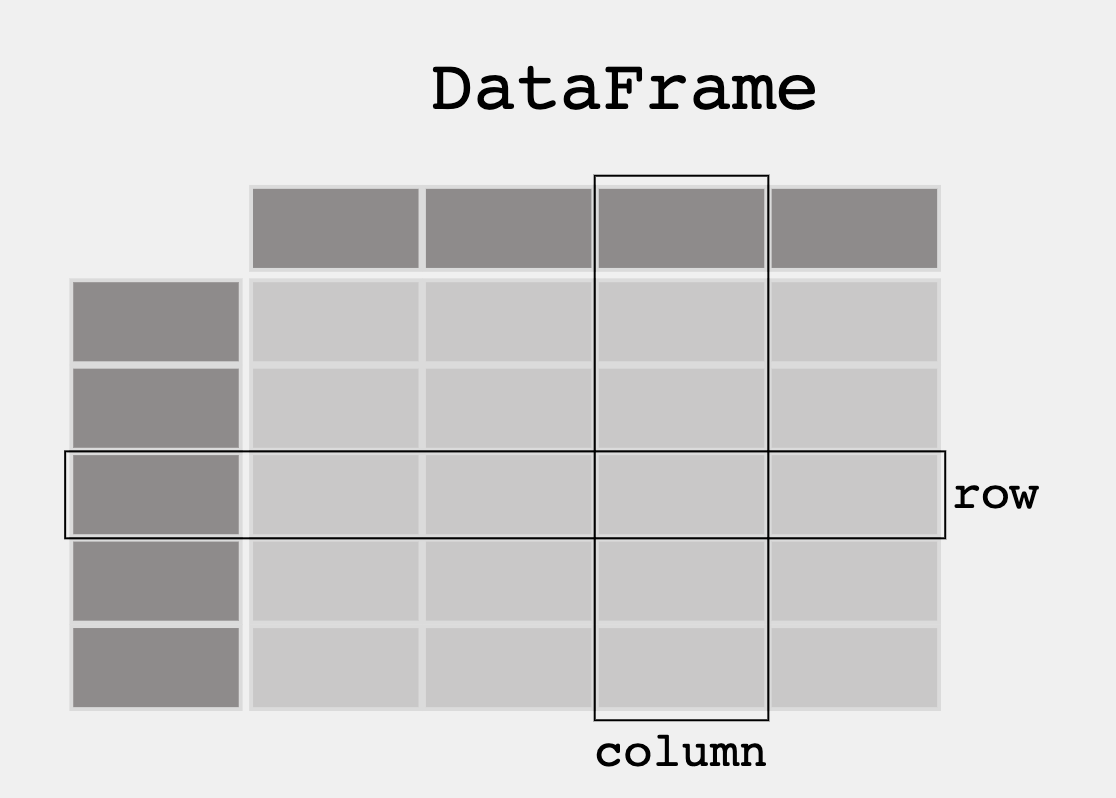
Pandas and DataFrames

In this lesson we will be exploring data analysis using Pandas.

  • College Board talks about ideas like
    • Tools. "the ability to process data depends on users capabilities and their tools"
    • Combining Data. "combine county data sets"
    • Status on Data"determining the artist with the greatest attendance during a particular month"
    • Data poses challenge. "the need to clean data", "incomplete data"
  • From Pandas Overview -- When working with tabular data, such as data stored in spreadsheets or databases, pandas is the right tool for you. pandas will help you to explore, clean, and process your data. In pandas, a data table is called a DataFrame.

DataFrame

'''Pandas is used to gather data sets through its DataFrames implementation'''
import pandas as pd

Cleaning Data

When looking at a data set, check to see what data needs to be cleaned. Examples include:

  • Missing Data Points
  • Invalid Data
  • Inaccurate Data

Run the following code to see what needs to be cleaned

df = pd.read_json('files/grade.json')

print(df)
# What part of the data set needs to be cleaned?
# From PBL learning, what is a good time to clean data?  Hint, remember Garbage in, Garbage out?
   Student ID Year in School   GPA
0         123             12  3.57
1         246             10  4.00
2         578             12  2.78
3         469             11  3.45
4         324         Junior  4.75
5         313             20  3.33
6         145             12  2.95
7         167             10  3.90
8         235      9th Grade  3.15
9         nil              9  2.80
10        469             11  3.45
11        456             10  2.75

Identifying Outliers (Interaction)

Some outliers include the grade in student 4 ("Junior"), 5 ("20") and 8 ("9th Grade"), and the Student ID "nil" for student 9.

Student 4's GPA also could or could not be correct. This could just be an outlier that's accurate or it could be a weighting problem.

Extracting Info

Take a look at some features that the Pandas library has that extracts info from the dataset

DataFrame Extract Column

print(df[['GPA']])

print()

#try two columns and remove the index from print statement
print(df[['Student ID','GPA']].to_string(index=False)) #HOW TO HIDE INDEX, FOR LATER
     GPA
0   3.57
1   4.00
2   2.78
3   3.45
4   4.75
5   3.33
6   2.95
7   3.90
8   3.15
9   2.80
10  3.45
11  2.75

Student ID  GPA
       123 3.57
       246 4.00
       578 2.78
       469 3.45
       324 4.75
       313 3.33
       145 2.95
       167 3.90
       235 3.15
       nil 2.80
       469 3.45
       456 2.75

DataFrame Sort

print(df.sort_values(by=['GPA']))

print()

#sort the values in reverse order
print(df.sort_values(by=['GPA'], ascending=False))
   Student ID Year in School   GPA
11        456             10  2.75
2         578             12  2.78
9         nil              9  2.80
6         145             12  2.95
8         235      9th Grade  3.15
5         313             20  3.33
3         469             11  3.45
10        469             11  3.45
0         123             12  3.57
7         167             10  3.90
1         246             10  4.00
4         324         Junior  4.75

   Student ID Year in School   GPA
4         324         Junior  4.75
1         246             10  4.00
7         167             10  3.90
0         123             12  3.57
3         469             11  3.45
10        469             11  3.45
5         313             20  3.33
8         235      9th Grade  3.15
6         145             12  2.95
9         nil              9  2.80
2         578             12  2.78
11        456             10  2.75

DataFrame Selection or Filter

print(df[df.GPA > 3.00])
   Student ID Year in School   GPA
0         123             12  3.57
1         246             10  4.00
3         469             11  3.45
4         324         Junior  4.75
5         313             20  3.33
7         167             10  3.90
8         235      9th Grade  3.15
10        469             11  3.45

DataFrame Selection Max and Min

print(df[df.GPA == df.GPA.max()])
print()
print(df[df.GPA == df.GPA.min()])
  Student ID Year in School   GPA
4        324         Junior  4.75

   Student ID Year in School   GPA
11        456             10  2.75

Create your own DataFrame

Using Pandas allows you to create your own DataFrame in Python.

Python Dictionary to Pandas DataFrame

import pandas as pd

#the data can be stored as a python dictionary
dict = {
  "calories": [420, 380, 390, 300],
  "duration": [50, 40, 45, 35] #I added new values
}
#stores the data in a data frame
print("-------------Dict_to_DF------------------")
df = pd.DataFrame(dict)
print(df)

print("----------Dict_to_DF_labels--------------")

#or with the index argument, you can label rows.
df = pd.DataFrame(dict, index = ["day1", "day2", "day3", "day4"])
print(df)
-------------Dict_to_DF------------------
   calories  duration
0       420        50
1       380        40
2       390        45
3       300        35
----------Dict_to_DF_labels--------------
      calories  duration
day1       420        50
day2       380        40
day3       390        45
day4       300        35

Examine DataFrame Rows

print("-------Examine Selected Rows---------")
#use a list for multiple labels:
print(df.loc[["day1", "day3"]])

#refer to the row index:
print("--------Examine Single Row-----------")
print(df.loc["day1"])
-------Examine Selected Rows---------
      calories  duration
day1       420        50
day3       390        45
--------Examine Single Row-----------
calories    420
duration     50
Name: day1, dtype: int64

Pandas DataFrame Information

print(df.info()) #prints with new data set in mind
<class 'pandas.core.frame.DataFrame'>
Index: 4 entries, day1 to day4
Data columns (total 2 columns):
 #   Column    Non-Null Count  Dtype
---  ------    --------------  -----
 0   calories  4 non-null      int64
 1   duration  4 non-null      int64
dtypes: int64(2)
memory usage: 268.0+ bytes
None

Example of larger data set

Pandas can read CSV and many other types of files, run the following code to see more features with a larger data set

import pandas as pd

#read csv and sort 'Duration' largest to smallest
df = pd.read_csv('files/data.csv').sort_values(by=['Duration'], ascending=False)

print("--Duration Top 10---------")
print(df.head(10))

print("--Duration Bottom 10------")
print(df.tail(10))
--Duration Top 10---------
     Duration  Pulse  Maxpulse  Calories
69        300    108       143    1500.2
79        270    100       131    1729.0
109       210    137       184    1860.4
60        210    108       160    1376.0
106       180     90       120     800.3
90        180    101       127     600.1
65        180     90       130     800.4
61        160    110       137    1034.4
62        160    109       135     853.0
67        150    107       130     816.0
--Duration Bottom 10------
     Duration  Pulse  Maxpulse  Calories
68         20    106       136     110.4
100        20     95       112      77.7
89         20     83       107      50.3
135        20    136       156     189.0
94         20    150       171     127.4
95         20    151       168     229.4
139        20    141       162     222.4
64         20    110       130     131.4
112        15    124       139     124.2
93         15     80       100      50.5

APIs are a Source for Writing Programs with Data

3rd Party APIs are a great source for creating Pandas Data Frames.

  • Data can be fetched and resulting json can be placed into a Data Frame
  • Observe output, this looks very similar to a Database
'''Pandas can be used to analyze data'''
import pandas as pd
import requests

def fetch():
    '''Obtain data from an endpoint'''
    url = "https://flask.nighthawkcodingsociety.com/api/covid/"
    fetch = requests.get(url)
    json = fetch.json()

    # filter data for requirement
    df = pd.DataFrame(json['countries_stat'])  # filter endpoint for country stats
    print(df.loc[0:5, 'country_name':'deaths']) # show row 0 through 5 and columns country_name through deaths
    
fetch()
  country_name       cases     deaths
0          USA  82,649,779  1,018,316
1        India  43,057,545    522,193
2       Brazil  30,345,654    662,663
3       France  28,244,977    145,020
4      Germany  24,109,433    134,624
5           UK  21,933,206    173,352

Hacks

Early Seed award

I hope you saw it during class.

AP Prep

I didn't make my own questions this time because I learned that we weren't really intended to do that. I did take the College Board practice quiz, though.

2.3 College Board Practice Problems

Here are the results of the 2.3 practice questions.

6/6
I got 6/6.

All of the questions had very clear answers, so I don't have a lot to reflect on. They were common sense questions above all else.

Personal Dataset Work

The next 4 weeks, Teachers want you to improve your understanding of data. Look at the blog and others on Unit 2. Your intention is to find some things to differentiate your individual College Board project.

  • Create or Find your own dataset. The suggestion is to use a JSON file, integrating with your PBL project would be Amazing.

  • When choosing a data set, think about the following...

    • Does it have a good sample size?
    • Is there bias in the data?
    • Does the data set need to be cleaned?
    • What is the purpose of the data set?
    • ...
  • Continue this Blog using Pandas extract info from that dataset (ex. max, min, mean, median, mode, etc.)

I decided to try applying Pandas sorting methods to my events database from the Cafe Gato project.

'''Pandas can be used to analyze data'''
import pandas as pd
import requests

def fetch():
    global eventdf
    '''Obtain data from an endpoint'''
    url = "https://cgato.duckdns.org/api/events/"
    fetch = requests.get(url)
    json = fetch.json()

    # filter data for requirement
    eventdf = pd.DataFrame(json)  # filter endpoint for country stats
    print(eventdf.loc[0:5, 'date':'name']) # show row 0 through 5 and columns country_name through deaths
    
fetch()
         date                email end_time  \
0  03/13/2023     fixer@icloud.com    13:00   
1  03/01/2023      lucky@magic.com    15:00   
2  03/07/2023    downer@icloud.com    13:45   
3  02/28/2023        cat@gmail.com    14:00   
4  03/04/2023  drewdafox@gmail.com    14:00   

                                       event_details  \
0                                We're gonna fix it!   
1  This is the month that St. Patrick's Day takes...   
2                         We're gonna break it down!   
3                                           adsfasdf   
4                                 Test for the class   

                       event_name  id              name  
0              The Fix Mix Flicks   3       Fixer Upper  
1  Beginning of March Celebration   5  Lucky Leprechaun  
2         The Down Breaker Clowns   6    Breaker Downer  
3                             cat   7               cat  
4              Test Day for APCSP   8         Drew Reed  

I decided to use Pandas for a process I spent a lot of time and effort on in the frontend...

Date Sorting

Below, I've sorted the data both by soonest and by latest.

Earliest

Below is sorted by earliest, plus only shows certain columns to save space.

print(eventdf.loc[0:4, 'date':'event_name'].sort_values(by=['date'], ascending=True))
         date                email end_time  \
3  02/28/2023        cat@gmail.com    14:00   
1  03/01/2023      lucky@magic.com    15:00   
4  03/04/2023  drewdafox@gmail.com    14:00   
2  03/07/2023    downer@icloud.com    13:45   
0  03/13/2023     fixer@icloud.com    13:00   

                                       event_details  \
3                                           adsfasdf   
1  This is the month that St. Patrick's Day takes...   
4                                 Test for the class   
2                         We're gonna break it down!   
0                                We're gonna fix it!   

                       event_name  
3                             cat  
1  Beginning of March Celebration  
4              Test Day for APCSP  
2         The Down Breaker Clowns  
0              The Fix Mix Flicks  

Latest

Below, the data is sorted by latest.

print(eventdf.loc[0:4, 'date':'event_name'].sort_values(by=['date'], ascending=False))
         date                email end_time  \
0  03/13/2023     fixer@icloud.com    13:00   
2  03/07/2023    downer@icloud.com    13:45   
4  03/04/2023  drewdafox@gmail.com    14:00   
1  03/01/2023      lucky@magic.com    15:00   
3  02/28/2023        cat@gmail.com    14:00   

                                       event_details  \
0                                We're gonna fix it!   
2                         We're gonna break it down!   
4                                 Test for the class   
1  This is the month that St. Patrick's Day takes...   
3                                           adsfasdf   

                       event_name  
0              The Fix Mix Flicks  
2         The Down Breaker Clowns  
4              Test Day for APCSP  
1  Beginning of March Celebration  
3                             cat  

Other Online Data

I decided to use a free health statistics API from RapidAPI and try to see things about it with Pandas. It mostly covers the basic health information of servings of common ingredients (so not full recipe details).

It's a fairly complicated data set, so I ended up spending a while just trying to isolate important data. Below, you can see that I managed to isolate the nutrition information.

import pandas as pd
import requests

# GET code
url = "https://edamam-food-and-grocery-database.p.rapidapi.com/parser"

querystring = {"ingr":"apple"}

headers = {
	"X-RapidAPI-Key": "f9dc4c060fmsh192fef0e86699c6p109981jsn882369c51285",
	"X-RapidAPI-Host": "edamam-food-and-grocery-database.p.rapidapi.com"
}

response = requests.request("GET", url, headers=headers, params=querystring)
json = response.json()
nutrients = json['parsed'][0]['food']['nutrients']
#fooddf = pd.DataFrame(json[1]['nutrients'])

#print(fooddf)
print(nutrients)
{'ENERC_KCAL': 52.0, 'PROCNT': 0.26, 'FAT': 0.17, 'CHOCDF': 13.81, 'FIBTG': 2.4}

The data above is only for "apple," however. I decided to try to expand the amount of data by removing the querystring.

In order to translate the acronyms, I had to look at the documentation for the API to correctly label it.

import pandas as pd
import requests

# GET code
url = "https://edamam-food-and-grocery-database.p.rapidapi.com/parser"

headers = {
	"X-RapidAPI-Key": "f9dc4c060fmsh192fef0e86699c6p109981jsn882369c51285",
	"X-RapidAPI-Host": "edamam-food-and-grocery-database.p.rapidapi.com"
}

response = requests.request("GET", url, headers=headers) #fetch with no query
json = response.json()

fooddata = [] #for appending data here
for data in json['hints']: #reformatting the information for the pandas table
	newdict = {'Name':data['food']['label'],
		'Calories':data['food']['nutrients']['ENERC_KCAL'],
		'Protein (g)':data['food']['nutrients']['PROCNT'],
		'Fat (g)':data['food']['nutrients']['FAT'],
		'Carbohydrates (g)':data['food']['nutrients']['CHOCDF'],
		'Fiber (g)':data['food']['nutrients']['FIBTG']}
	fooddata.append(newdict)

fooddf = pd.DataFrame(fooddata)
#print(fooddf)

Since that prints a whole lot of data, I decided to narrow it to the top five.

Here is the top five most protein-rich ingredients in the list. So that it would stay within one line, I made it cut off at 'Fat (g)'.

print(fooddf.loc[0:5, 'Name':'Fat (g)'].sort_values(by=['Protein (g)'], ascending=False))
                         Name  Calories  Protein (g)  Fat (g)
4               Cheese, Brick     371.0        23.24    29.68
3                Cheese, Blue     353.0        21.40    28.74
5                Cheese, Brie     334.0        20.75    27.68
0              Butter, Salted     717.0         0.85    81.11
1  Butter, Whipped, With Salt     717.0         0.85    81.11
2       Butter Oil, Anhydrous     876.0         0.28    99.48

The data that it's letting me pull is usually at the start of the aphabet. There may be more with the full, paid version of the API. This shows that some variations of cheeses have more protein than others in the full list.

Hack Helpers

To declutter my blog, I decided to delete this section since it's in the source article anyway. For my own personal reference, it can be found here.